Learning Resources
Lesson
This Focus introduces the shapes of cubic and quadratic functions. You will see the relationship between the shape of the graph of a function and the number of real roots that exist.
Before beginning Focus A, you need a solid understanding of quadratics; the relationship between the roots and the shape of the graph.
Quadratic equations are of degree 2. This means that they will have two roots. The two roots in question may be 2 different real roots, 2 real roots which are the same, or the roots may both be complex numbers (i.e. imaginary roots).
Why is it that if any of the roots are indeed complex, both must be? In other words, why can't a quadratic equation have one complex root and one real root? Record your answers, and then check your responses.
For review purposes, do the questions below before attempting the Focus.
Find the roots of each quadratic equation. Record your answers in your notebook.
y = x2 - x - 6
y = x2 - 6x + 9
y = x2 + x + 4
After you have solved these equations, look in the margin on page 65 of your text and compare the roots you found to the x-intercepts of the graphs. Answer the following questions.
- How do they compare?
- What would be the x-intercepts of the third equation you solved?
From your work with quadratics, you should see that the degree of a polynomial indicates the number of roots that exist. Just as a quadratic has two roots, a cubic has three roots, and a quartic has four roots. What you must realize is that the degree tells us the number of roots that exist, not necessarily the number of real roots that exist. What we do know, however, is that the number of different real roots will equal the number of x-intercepts. The x-intercepts will occur at these real roots.
Recall that a quadratic can have two real roots (either alike or different) or two different imaginary roots. Justify and record your answers to the following questions.
- What is the maximum number of imaginary roots that a cubic equation can have?
- Is a cubic guaranteed to have any real roots? Is a quartic?
To summarize: the degree of a polynomial indicates the number of roots that exist. Your task will be to determine if these roots are real or complex. This knowledge will be used to graph the polynomials. The x-intercepts, you will discover, force the shape of the graph. Thus, it is essential to determine these values when graphing polynomial functions. The y-intercept is also an essential piece of information.
Read Focus B on pages 63 & 64 of your text, paying particular attention to patterns that exist. A summary of each step is provided. View this information only after you have read each step of the Focus.
Some of you may be experiencing difficulty and frustration trying to distinguish between all the different shapes. After the concept of derivatives is studied later in this chapter, things will become clearer. Meanwhile, concentrate on looking for patterns, such as differences in the factors and y-intercepts. Be alert as to when a graph will cross the x-axis, touch the x-axis, or flatten out around the x-axis.
Answer the Focus Questions. You will be introduced to other possibilities for the shapes of cubic and quartic functions.
Activity
Focus questions page 64 - 66 #'s 24 -30
When you have completed these questions, ask your on-site teacher to get the solutions for you from the Teacher's Resource Binder and check them against your answers. After you do this, if there is something you had trouble with and still do not understand, contact your on-line teacher for help.
Test Yourself
Examine each polynomial equation below. Make and justify a possible sketch for each.
- y = (x + 1)(x + 2)2
- y = -(x + 3)(x - 4)(x2- 4)
- y = (x2 + 2)(x - 1)2
Solutions
To accurately visualize a sketch, you will need to find the x and y-intercepts of the polynomial function. As well, you must keep in mind whether the polynomial is positive or negative. This will help you determine the quadrants in which the graph occurs.
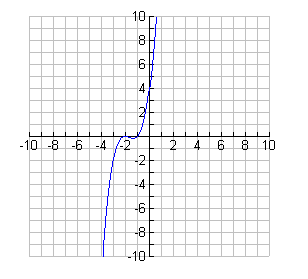
- This graph is a horizontal translation of the graph of y = x3. It is a positive cubic with three real roots. One root is -1 and there is a double root of -2.
Thus, the graph crosses the x-axis at -1 and touches it at -2. The y-intercept is 4.
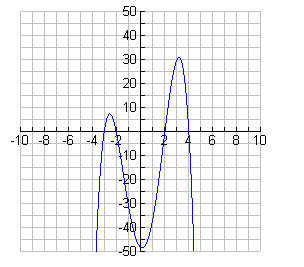
- It is a negative quartic with four different real roots. The roots are -3, 4, 2
and -2. Hence, the graph crosses the x-axis at each of these values. The
y-intercept is -48.
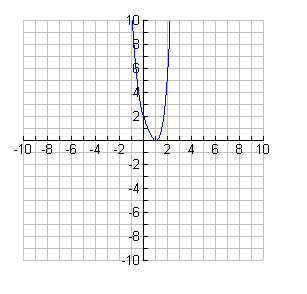
- This is a positive quartic with two real and two imaginary roots. The two
real roots are equal, indicating a double root of 1. Thus, the graph
touches the x-axis at 1. Since the other roots are complex, there are no
other x-intercepts. The y-intercept is 2.