
Learning Resources
Lesson
In this investigation you will explore a real world situation where exponential growth occurs. To save time and to get more values for your data set, it will be best to work in pairs or small groups to complete the exploration.
You will appreciate the investigation much better if you do the experiment using pennies as it is described in your text . To do this you will need 100 or more pennies and a container in which to shake them.
You can also simulate the tossing of pennies (or any other binomial event) on your TI83. If you have completed Math 2204 this will be fairly easy for you, as you used this method for many of the investigations in Unit 5 of that course.
On the TI83, the randBin function can be used to simulate any binomial experiment. Thus, randBin(15, 0.5) means to randomly perform an experiment 15 times (or do one experiment with 15 trials) in which the probability of success on any one trial is 0.5 (i.e. a 50% chance of the event occurring). We could think of this as tossing 15 coins, since each is likely to land heads 50% of the time.
The screen below shows the results of doing this for a few trials:
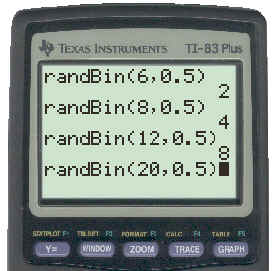
To see the key strokes necessary to get this result click here.
Using the above results to complete the first three entries in the table in your text would give:
Trial # |
0 |
1 |
2 |
3 |
... |
9 |
# pennies |
6 |
8 |
12 |
20 |
|
|
Using either the coin toss or the simulation you should now be able to complete Steps A and B of the Investigation and complete the table above for at least nine trials. It is important that you collect your own data before you proceed with the rest of the lesson.
Once you have the data collected the next step is draw a scatter plot and use technology to find the equation of the curve of best fit.
Once you have the data collected, you can plot the points on graph paper to see if any of the relations we have discussed (e.g. straight line, parabola, exponential, etc.) might be used to model it. The points can also be plotted on the TI83 once the data has been entered into lists.
Example
Use the data in the following table to create a scatter plot (remember this is only sample data and you must find your own for the investigation). Then generate the function that best models the data.
| Trial Number | 0 |
1 |
2 |
3 |
4 |
5 |
6 |
7 |
8 |
9 |
| Number of Pennies | 6 |
9 |
12 |
16 |
21 |
33 |
42 |
64 |
97 |
151 |
Solution
Enter the trial number into List L1 and the number of pennies into List L2 on the TI 83 and then create a scatter plot. The results are shown below:
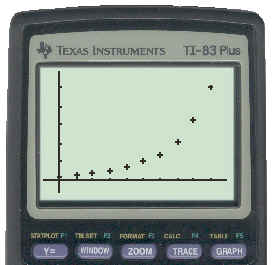
To see the keystrokes necessary to get this scatter plot click here.
The scatter plot indicates that the data might be exponential, so we can do an Exponential Regression on the data already entered in Lists L1 and L2. The results of this are shown below:
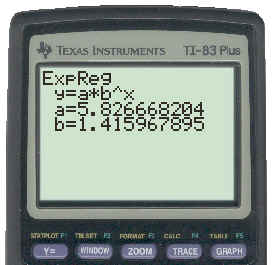
From the above, we can see that the function that best models the data can be given as: y = 5.827(1.416)x . To see the key strokes necessary to get this equation click here.
If you wanted, you could graph this regression equation and see how it passes through the given data. That is left as an exercise for you to do.
Activity
- Complete Investigation 6 on page 131 in your text.
- Complete the Investigation Questions 13 - 20 on page 131 & 132.
- Do the CYU Questions 21 - 23 on pages 132 & 133.
When you have completed these questions, ask your on-site teacher to get the solutions for you from the Teacher's Resource Binder and check them against your answers. After you do this, if there is something you had trouble with and still do not understand, contact your on-line teacher for help.
Test Yourself
A sociologist studying out migration in Newfoundland found the following data for one particular community:
Year |
1975 |
1980 |
1985 |
1990 |
1995 |
2000 |
Population |
1600 |
1475 |
1355 |
1245 |
1145 |
1055 |
Use your TI83 to draw a scatter plot of the data and to find the equation of the function that best models it. Use this function to predict the population in 2005.