Learning Resources
Investigation 6: Pennies from HeavenTest yourself
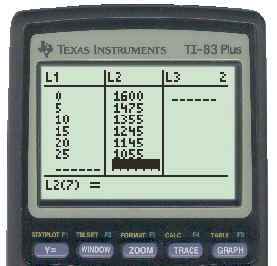
Let 1975 be year 0. The other years then become year 5, 10, 15 , 20, etc. Enter this in List L1. Enter the corresponding populations in List L2. This is shown below:
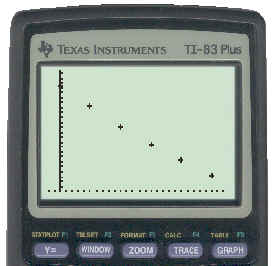
Now draw a scatter plot of this data that we have entered in Lists L1 and L2. This is shown below:
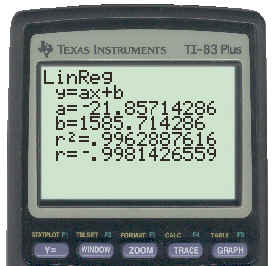
It is difficult to tell from the graph if it is linear or exponential. We will perform both a linear and an exponential regression and see which one "fits the best". First the linear regression is shown below:
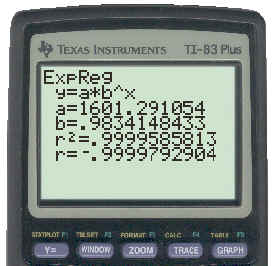
Next the exponential regression is completed:
To find what the population will be in 2005 if this trend continues, we substitute x = 30 (2005 is 30 years after the start of the data) into the regression equation. This gives: y = 1601 (0.9834)30 = 968.9 Since the population must be a whole number, we round the answer to 969. |