
Learning Resources
Lesson
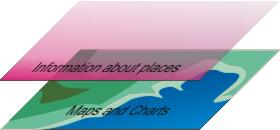
GIS is a technology that combines information stored in databases with information in maps. The map or diagram gives a visual reference that people can relate to. Information is then 'layered' on the map as it is needed. The figure below illustrates the concept, or idea. A single layer of information is added. It could contain information about the places on the map, including population and street maps.
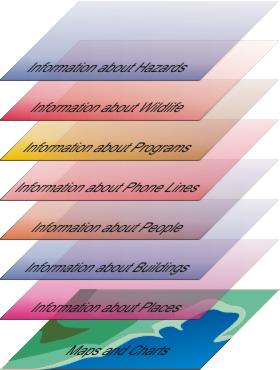
Many additional layers of information could be added. They can be turned on and off as they are needed. The next diagram shows 6 additional layers of information. Each layer can contain a variety of related bits of information. The phone line layer, for example can contain information for the phone company about the location of utility poles, switching stations, and other critical equipment. It could also include subscriber information about the phones connected to the system.
GIS systems are computers with specialized GIS software. The software has tools to work with maps, charts and diagrams. There are tools to create databases and store information in an organized format. There are tools to connect to databases on other computers and in other locations. The key components are the tools that allow information in the databases to be connected to places and things on the map.
GIS systems are dependant for their usefulness on
- the types and quality of the information, or data, that can be included
- the kinds of questions you can ask
- the kinds of answers the system can give
GIS systems are used to answer the following kinds of questions by placing the appropriate overlay information on a map
- What is at a given location, for example buildings, people, natural resources, toxic materials? The limit is only defined by the data that is available in the databases
- What are the conditions at particular locations at particular times? This can be used, for example, to show the current pattern of snowfall or effluent in a river, the distribution of fibre optic cables in relations to population density, or forest patterns by tree species.
- Trends, or changes over time. This can be used, for example, to show relationships between temperature and precipitation changes over time and the distribution of plant and animal species, or relationships between changes in populations and changes in services available to communities.
- Patterns related to the physical space of the area. You could examine the distribution pattern of wildlife and of industrial activity and determine if there are zones that animals have vacated.
- Modeling. The system can be used to determine answers to 'what if' questions. What would happen if commercial fishing started in this area? what if we build a road or a subdivision?
A GPS receiver, for example, is a specialized GIS system. It determines the location of the receiver relative to satellites and it shows its location on a map. It can show where you have been and where you are going, as well as obstacles and other important information about your route.
Activity
Assigned activities
Speculate on the applications for a GIS system on the bridge of a ship. Consider that it has to track locations of ships at sea, hazards and navigation aids in coastal areas, and show the ship's operation within a specified shipping lane. Develop a profile of the kinds of information that could be displayed on the system and the ways it could be used in navigation.
The following starting points for research may be helpful.
- http://www.gis.com/whatisgis/index.html
- http://volusia.org/gis/whatsgis.htm
- http://www.geo.ed.ac.uk/agidict/alpha.html (dictionary)
- http://members.tripod.com/krismaps/algonquin/ (case studies)
- http://www.manifold.net/big_index.html (link to a commercial site, but it has a lot of information about uses of GIS)
- http://dusk.geo.orst.edu/geoinfo.html (At Sea with GIS)
Test Yourself
There is no self test for this lesson.