
Learning Resources
Home » » Courses » Mathematics » Advanced Mathematics 3207 (delisted) » Unit 02 » Set 05 ILO 04 » Solution
Investigation 10: Graphing the Slope Function
The expression for the slope function is f /(x) = 1 - 2x. The graph of the original function and the slope function are shown below.
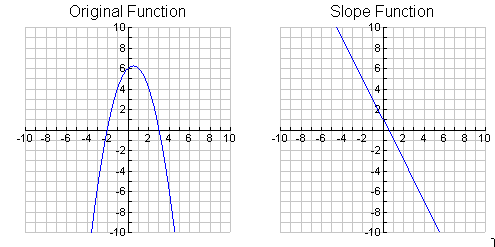
Examining, from left to right, the graph of the Slope Function indicates that it goes from positive y-values, to a y-value of zero, to negative y-values. This means:
- The original graph increases, has a vertex (when the slope of the function is zero), and then decreases. If you trace the graph of the original function, moving form left to right, you will find this analysis to be accurate.
- The x-coordinate of the vertex of the original function is 0.5. Thus, this is the x-intercept of the slope function.
- The original function is increasing over the interval (-
 , 0.5). Thus, the derivative is positive over this interval. This means that the graph of the slope function will have positive y-values for all values of x from -to 0.5.
 - The original function is decreasing over the interval (0.5, ). Thus, the derivative is negative over this interval. This means that the graph of the slope function will have negative y-values when for all values of x from 0.5 to .