
Learning Resources
To complete this problem create a table of values as follows for the lengths of each side and use the formula ![]() to calculate each area.
to calculate each area.
|
Base |
1 |
2 |
3 |
4 |
5 |
6 |
7 |
8 |
9 |
10 |
|
Height |
99 |
98 |
97 |
96 |
95 |
94 |
93 |
92 |
91 |
90 |
|
Area |
49.5 |
98 |
145.5 |
192 |
237.5 |
282 |
325.5 |
368 |
409.5 |
450 |
Method 1
Use a scatter plot and quadreg to find the equation.
![]()
Method 2
Find a sequences of differences from the Area row of the table
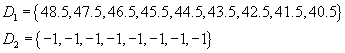
Since the second-level differences is -1, the coefficient a is ![]()
Substitute this into ![]() with the first two terms of the sequence to find the following equations:
with the first two terms of the sequence to find the following equations:
|
|
|
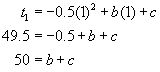
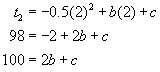
Using substitution we have
![]()
Since ![]() , we have c = 0.
, we have c = 0.
This gives us the equation ![]()
An appropriate WINDOW setting and graph are shown below:
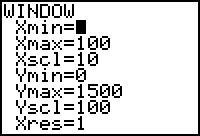
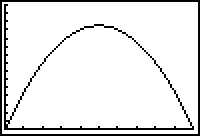
Use TRACE to find the coordinates of the maximum point (50,1250); which tells us that the maximum area is 1250 m2 when a side is 50 metres.