
Learning Resources
Lesson
The bacteria culture under study in Focus H starts with one bacterium per square centimetre and increases by a factor of 10 each day. If x represents the number of days and y represents the number of bacteria, then a table of values can be created as below:
| Day | 0 |
1 |
2 |
3 |
4 |
... |
| # bacteria | 1 |
10 |
100 |
1000 |
10000 |
|
Question 1
The first question in Focus H requires the equation and graph for these values to be found. The data is for a growth curve and can be modeled by a simple exponential function of the form y = abx . Recall that a is the initial amount and b is the common ratio. Once you have the equation, use the TI83 to graph it. The values in the table above should give you a clue about setting the [WINDOW] settings to use on your TI83. For example, you could let Xmin = 0, Xmax = 6,
Ymin = 0, Ymax = 10 000.
Question 2
To determine the number of bacteria present after any number of days or fraction of days as required in question 2 is simply a matter of substituting that value for x into the equation and evaluating the resulting expression. Use your TI83 to evaluate 10x for the given value of x.
Question 3
To find the number of days when the number of bacteria will be at a particular level is fairly straight forward when the number of bacteria is a power of 10. Substitute in the given value of y (the number of bacteria) and solve the resulting exponential equation which will have a base 10 expression on each side of the equal sign.
Question 4
This question poses an interesting problem. When the value is substituted into the equation we get the equation below:
700 = 10x
Since 700 cannot be expressed as an integral power of 10, the equation cannot be solved easily by getting the same base on both sides and equating the exponents.
One possibility for solving this equation is to use the [TRACE] function and move the cursor along the graph of y = 10x until y = 700. Then note the value of x that corresponds to this.
Another option is to use the [TABLE SET] function and refine TblStart and DTbl to get the desired accuracy. The solution correct to three places after the decimal is shown below:
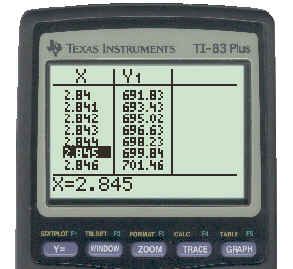
To see the key strokes necessary to get this result, click here.
Question 6
In this question you are asked to use the [LOG] key on your calculator and discover the relation between the LOG and the answer you obtained to Question 4. You should note that to solve the equation ![]() , you can use the calculator and solve the equation
, you can use the calculator and solve the equation ![]() .
.
The answer to this question seems to indicate that the value of the log gives the domain value (x) that corresponds to the range value (y) in an exponential equation. The next part of the lesson looks at this in more detail.
An inverse operation reverses the work that has already been completed. For example, 7 x 5 = 35 and 35/5 = 7, so we say that division is the inverse operation of multiplication.
The idea of inverses can be applied to functions as well as to operations. In this part of the lesson we want to consider the inverse function to the exponential function.
The inverse of a function is found by interchanging the x and y values. If these values are interchanged, then you get a reflection of the original function in the line y = x.
For example, if the x and y coordinates of the point (1,2) are interchanged we get the point (2,1). The second point is a reflection of the first point in the line
y = x. This is shown in the diagram below.
We can apply this principle to finding the inverse of a function as is illustrated in the example which follows.
Example
Find the inverse of y = 10x by using tables and graph each on the same co-ordinate plane.
Solution
A partial table of values for y = 10x is given below:
x |
-3 |
-2 |
-1 |
0 |
1 |
2 |
3 |
y |
|
|
|
1 |
10 |
100 |
1000 |
A partial table of values for the inverse function can be found by interchanging the x and y values as shown below:
y |
-3 |
-2 |
-1 |
0 |
1 |
2 |
3 |
x |
|
|
|
1 |
10 |
100 |
1000 |
Using these points to draw the graph of both the original function and its inverse on the same set of axes we get:
The inverse of ![]() (the blue graph) is reflected in the line y = x (the red dotted line) as evidenced by the interchange of the coordinates for the marked points.
(the blue graph) is reflected in the line y = x (the red dotted line) as evidenced by the interchange of the coordinates for the marked points.
The equation describing the inverse of ![]() is
is ![]() since the x and y values were interchanged.
since the x and y values were interchanged.
The equation ![]() cannot be solved by ordinary algebraic methods. The term logarithm was used to describe this function and is written as
cannot be solved by ordinary algebraic methods. The term logarithm was used to describe this function and is written as
![]()
The 10 is known as the base of the logarithm and the x the argument of the function. Also, the log key on your calculator represents the logarithm with base 10.
In general, when we have an exponential function of the form ![]() it can be converted to the logarithmic form
it can be converted to the logarithmic form ![]() .(Note that the base of the exponent is the base of the logarithm ; the y value of the exponential form is the argument of the logarithm; and the exponent of the exponential form is the value of the logarithm). This is shown in the diagram below:
.(Note that the base of the exponent is the base of the logarithm ; the y value of the exponential form is the argument of the logarithm; and the exponent of the exponential form is the value of the logarithm). This is shown in the diagram below:
In the questions for Focus I, it is essential that you read and study the introduction to each . Use technology to help complete Question 7. Pay particular attention to the terminology introduced in Question 8 as it will be used extensively for the remainder of the exercises in this section.
Before you proceed with the rest of this lesson complete Focus I on pages 173 & 174 in your text.
If you have completed the questions in Focus I, you should have discovered the following:
- A logarithm is written in the form logb a, where b is referred to as the base and a is the argument. The logarithmic equation logb a = n is equivalent to the exponential equation bn = a. Thus log2 32 = x is equivalent to 2x = 32.
- If the base is omitted from the expression, it is automatically assumed to be 10. Thus the expression log 25 means log10 25. The log button on your calculator is log to base 10. It returns the value to which 10 has to be raised to get the argument entered.
- Two relations are inverses of one another if they satisfy these three conditions:
1. Their graphs are reflections of one another in the line y = x.
2. The x and y values have been interchanged in the ordered pairs.
3. The x and y values have been interchanged in the equations.
Facility with converting from logarithmic to exponential form is crucial to the understanding of the work which follows. The examples in the interactive below show some examples of this conversion. Try each one yourself before advancing to the next step to check your answer.
We can also solve equations which contain logarithmic expressions by first converting them to exponential equations and then using the skills we learned in previous lessons in this section. The examples below show how this is done.
Example
Solve each of the following for x:
(a) ![]() (b)
(b) ![]() (c)
(c) ![]()
Solution
(a) Convert the log form into exponential form and solve for x .

(b) Convert the log form into exponential form and solve for x .

(c) Convert the log form into exponential form and solve for x .
Activity
- Read through the problem for Focus H and complete the Focus Questions 1 - 6 on page 172 in your text.
- Read Focus I and complete the Focus Questions 7 - 10 on pages 173 & 174 in your text.
- Do the CYU Questions 11 - 15 on pages 174 & 175.
When you have completed these questions, ask your on-site teacher to get the solutions for you from the Teacher's Resource Binder and check them against your answers. After you do this, if there is something you had trouble with and still do not understand, contact your on-line teacher for help.
Test Yourself
Convert ![]() to logarithmic form.
to logarithmic form.
2. Convert ![]() to exponential form.
to exponential form.
3. Evaluate: ![]()
4. Solve for x : ![]()