
Learning Resources
Lesson
This part of the lesson asks you to consider the graphs which model real world situations. It will be a review for those of you who have completed Mathematics 2204. Remember that the graph is just a picture of what is happening in the real world.
Try to think in terms of how the dependent variable is changing with respect to the independent variable. Is the change constant? What type of graph will this produce? Is the change increasing or decreasing? What is the shape of these graphs? Does the change vary - sometimes increasing, sometimes decreasing? What would the graph of that look like?
Example 1
Water is flowing into a cylindrical can from a tap which has a constant rate of flow. What would the graph of height of water in the can versus time look like? Sketch the graph on your notebook before you look at the solution in the interactive below.
Solution
What would change about the above graph if the rate of flow of the water in the tap were half as much? To see the answer click here.
Example 2
A person enters the seat of a Ferris Wheel 2 m above the ground. They ride the wheel for five revolutions. What would the graph of height above ground versus time look like? Sketch the graph on your notebook before you look at the solution in the interactive below.
Solution
What would change about the above graph if the Ferris Wheel were larger? If it rotated faster? To see the answer click here.
Before you go to the next page in this lesson, go to pages 108 & 109 in your text and complete Focus A and the questions associated with it.
We now want to look in detail at modeling a particular type of change.
In Unit 1 we discussed arithmetic and quadratic sequences. We learned about their properties and how to generate them.
In Investigation 1 in this lesson we will consider another type of sequence. It is called a geometric sequence and is generated by multiplying each successive term in the sequence by the same number called the common ratio.
As an example of this, let's consider the following version of a well know problem.
Example
A young student received a summer job for the month of July from an eccentric millionaire. The millionaire offered to pay the student 1 cent the first day, 2 cents the second day, 4 cents the third day, 8 cents the fourth day and so on. Alternately, he offered to give the student a lump sum of $1 000 000 when he finished the job. If you were that student, which offer would you take? Justify your answer.
Solution
Before you jump to conclusions, do some calculations of the first offer and put your results in a table like the one below:
Day |
1 |
2 |
3 |
4 |
5 |
6 |
7 |
8 |
9 |
10 |
Amount |
1 |
2 |
4 |
8 |
16 |
32 |
64 |
128 |
256 |
512 |
Amount |
20 |
21 |
22 |
23 |
24 |
25 |
26 |
27 |
28 |
29 |
Continuing this pattern, on the last day of July, which has 31 days, you would receive 230 dollars. Expanding 230 gives 1 073 741 824. This means that on the 31st day alone your salary would be $10 737 418.24. Your salary for the 31 days would be the sum of all these powers of 2, which would be much more than
$1 000 000.
The above example illustrates how rapidly a geometric sequence increases or grows. The type of growth that gives rise to these sequences is referred to as exponential growth. We will discuss this at length later in the unit. For now, let's concentrate on the properties of the geometric sequence itself.
First note that the function rule for generating the nth term in the sequence in the example is 2n-1. For example,
5th term = 25 - 1 = 24 = 16
9th term = 29 - 1 = 28 = 256
Also note the ratio of successive terms, that is note ![]() . For example:
. For example:
![]() ,
, ![]() ,
, ![]()
The common ratio for this sequence is 2.
If we multiply each of the terms in the sequence in the example by 5 to make a new sequence we get:
{5 , 10, 20, 40, 80, 160 ...}
If we take a few examples of the ratio of successive terms in this sequence we get:
![]()
![]()
The common ratio is still 2. Note that the terms in that sequence can be expressed as follows:
{5 x 1 , 5 x 2 , 5 x 4 , 5 x 8 , 5 x 16, ...} = {5 x 20 , 5 x 21 , 5 x 23 , 5 x 24, 5 x 25...}
The function rule for the nth term in this new sequence is 5 x 2n - 1.
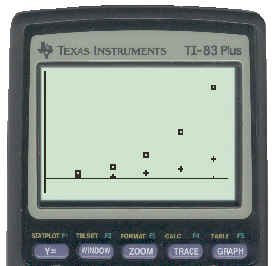
We can use our TI83 to get a plot of the two sequences. Enter the term numbers in L1, the first sequence numbers in L2 and the second sequence numbers in L3 and plot. The resulting graphs look as follows, with + marking the points in the first sequence.
Investigation 1 in your text asks you to look at similar questions about geometric sequences. In the example in the book, the sequence is generated by nuclear fission. You should go to the web sites recommended in the margin of your text on page 110 to see an animation of how fission works.
Activity
- Read through Example 1 in Focus A on page 108 in your text.
- Complete Focus A Questions 1 & 2 on pages 108 & 109.
- Complete Investigation 1 on pages 110 & 111.
- Complete Investigation Questions 3 - 6 on page 111.
- Do the CYU Questions 7 - 11 on pages 112 & 113.
When you have completed these questions, ask your on-site teacher to get the solutions for you from the Teacher's Resource Binder and check them against your answers. After you do this, if there is something you had trouble with and still do not understand, contact your on-line teacher for help.
Test Yourself
- Write each of the terms of the sequence {4, 12, 36, 108, ...} as a multiple of a power.
- A picture that is 12 by 15 is to be reduced on a photocopy machine. If each successive copy reduces the preceding image by 20% , how many times must it be reduced to obtain a picture that is approximately 5 by 6?