
Learning Resources
Lesson
Recall from the previous section that speed was defined as an the average rate of change. It is the ratio of the difference in the distance compared to the difference in time and is calculated as follows:
![]()
From previous work in mathematics you know that the slope of a line is given as follows:
![]()
In the previous section, the similarity between the two was noted. We discovered that the average rate of change between two points on any curve is the same as the slope of the line passing through these two points. Such a line as this, which passes through two points on a curve, is called a secant to the curve. This is shown in the diagram below.
The connection between the slope of a secant line and the average rate of change is used extensively in Investigation 2 on page 85 of your text. Make sure you understand it thoroughly before you move on.
Some explanation and help with Investigation 2 is provided below.
Read and study the introduction to the investigation taking note of the extensive table of values. The table breaks down the distance versus time over three minutes, divided into 5 second intervals. The times in the table are recorded by starting at 0 and adding on 5 seconds for each entry. Some of the corresponding "clock times" are shown below:
12:43:00 -------------------- 0
12:43:05 -------------------- 5
12:43:10 -------------------- 10
.
.
12:44:00 -------------------- 60 (1 min or 60 sec after the start)
12:44:05 ---------------------65 (65 sec after start)
.
.
12:44:55 -------------------- 115
12:46:00 -------------------- 120 (2 min or 120 sec after the start)
etc.
The purpose of this investigation is to observe the relationship between the slope of a tangent to a curve at a point and the rate of change of the curve at that point. To complete this investigation you will require graph paper and/or graphing technology such as the TI83.
For Step A, it is recommended that you use technology to help draw the graph. Using the [STAT] menu on the TI-83 graphing calculator and the [1:Edit] sub menu, input the times into L1 and the distances into L2. Use the [STAT PLOT] menu to plot L1 against L2. In the [WINDOW] set x between 0 and 310 and y between 0 and 6700, then [GRAPH]. Once this is complete you will have a graph that resembles the one below.
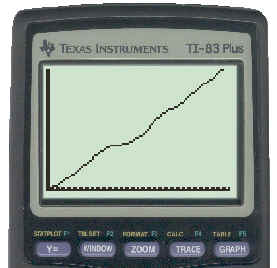
To see the key strokes necessary to get this graph, click here.
Copy this graph into your notebooks on a larger scale if possible. Although the points on the plot are discrete, in real life the car does not "jump" from one point to the other. There are points in between, but they have not been plotted. It thus makes sense to connect the points with a continuous curve.
For Step B, you can connect the two points using the TI83. In the [WINDOW], set x between 50 and 250 to give a bigger view of this section of the graph. To draw the secant connecting (60,1276) and (240,5144), from the home screen, use the [DRAW] menu and the [2:Line] sub-menu and enter the coordinates of the points you wish to connect with the segment. The result looks something like the following:
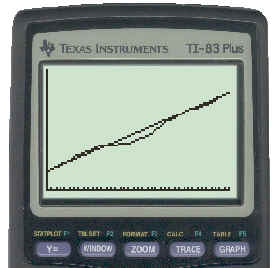
To see the key strokes necessary to get the secant line, click here.
To find the slope, use the formula or try to find it from the graph itself.
For Step C, repeat the procedure above for the two given pairs of times.
Step D is the crucial step in the investigation. Look at the graphs you have from Steps B and C. The slopes of these secant lines which should lead you to the conclusion regarding the tangent line at (150,2757). Remember these slopes are essentially the rate of change or speed of Mr. Lam for these time intervals. What does the slope of the tangent at (150,2757) represent in this context?
Step E repeats the above process for different time intervals around 12:46:00, which is time 180 or 3 minutes after the start. The first interval is 120 sec, so investigate the secant connecting 60 before 180 and 60 seconds after 180. That is, look at the secant connecting 120 to 240. Then repeat the process for a 60 sec interval, etc. Each time making the points of the secant closer and closer together and approaching the tangent point.
Activity
- Complete Investigation 2 on pages 85 & 86 in your text.
- Complete the Investigation Questions 1 - 6 on page 86.
- Do the CYU Questions 7 & 8 on pages 86 & 87.
When you have completed these questions, ask your on-site teacher to get the solutions for you from the Teacher's Resource Binder and check them against your answers. After you do this, if there is something you had trouble with and still do not understand, contact your on-line teacher for help.
Test Yourself
Using the graph and/or the table from the investigation find:
- the average speed between 12:44:00 and 12:45:00
- the average speed between 12:44:15 and 12:44:45
- the average speed between 12:44:25 and 12:44:35
- the estimated speed at 12:44:30