
Learning Resources
Lesson
Recall from earlier work that the slope of the line indicated a number of characteristics about the graph of the line. These characteristics are listed below:
- lines with positive slope slant upward from left to right.
- lines with negative slope slant downward from left to right.
- lines with zero slope are horizontal.
- vertical lines have no slope.
- the steeper the line the greater the absolute value of the slope of the line.
These points should be helpful as you complete the questions in Focus A on page 78 in your text.
Focus A
For Step A construct a graph and connect the points. Two points from the table and the segment connecting them are shown in the graph below. Complete a similar graph in your own note book for all the points in the trip.
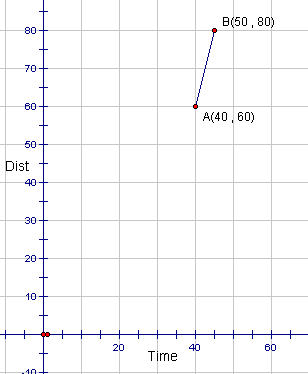
In Step B you are asked to calculate the average speed for a particular segment of the trip. For the part of the trip graphed above the average speed is:
![]()
In Step C you are asked to calculate the slope of the line segment for the same part of the trip. To do this use the coordinates of the end-points of the segment and the slope formula. For the segment graphed above, this gives:
![]()
For Step D and E, think about the "steepness" of the line segments and what it represents. You can determine when the speed (i.e. rate ) changed either by calculation or by examining the steepness of the segment between the points.
For Step F, first convert 30 km/h to km/min since the graph is in km/min. Find segments on the graph where the slope is that number of km/min to find the correct answer.
For Step G, you should notice that the data does not appear to be linear - not in a straight line. You should think of the other type of functions you have dealt with that might model the data. To find this function, check the sequence of differences. At what level are they constant? Use this and the skills from the previous unit to find the function.
Activity
- Complete Focus A on page 78 in your text.
- Complete the Focus Questions 7 - 12 on page 79.
- Complete the CYU Questions 13 - 25 on pages 79 - 83.
When you have completed these questions, ask your on-site teacher to get the solutions for you from the Teacher's Resource Binder and check them against your answers. After you do this, if there is something you had trouble with and still do not understand, contact your on-line teacher for help.
Test Yourself
- A ball thrown into the air with a velocity of 22 m/sec is h meters above the ground after t seconds where h(t) = -4.9t2 + 22t . What is the average rate of change in height:
(a) between 0 seconds and 2.2 seconds?
(b) between 2.2 seconds and 4.5 seconds?
(c) How do you interpret these results? - The table below shows the number of people in the age range from15 to 24 years in Canada during various census years:
Census
year
Number
of people
age 15 -24
Total
Canadian
population
1931
1 952 000
10 377 000
1941
2 152 000
11 507 000
1951
2 157 000
14 010 000
1961
2 617 000
18 238 000
1971
4 004 000
21 568 000
1981
4 659 000
24 568 000
1991
3 831 000
27 297 000
(a) What would the calculation
 tell you about
population change in Canada?
tell you about
population change in Canada?(b) During what ten year period shown in the table did the percent of the population that is 15 to 24 years old grow the most?
(c) Would you expect the population of Canada to grow at the same rate as the number of people aged 15 to 24 years? Explain why or why
not.