
Learning Resources
Lesson
One question that is often asked about any function is whether it has a maximum or a minimum value. This is sometimes necessary regardless of whether the function was obtained by regression or by algebraic methods.
Investigation 4 in your text on page 20 deals with a situation where a gardener has 50 m of fencing to enclose a rectangular garden. The garden touches a wall on one side and doesn't need any fencing. You are asked to determine the dimensions of the garden that will give a maximum area. Two possibilities and the defining equation for this problem are shown in the interactive below. Work it through before proceeding on with the rest of the lesson.
Once you have obtained a function there are several ways of determining whether or not it has a maximum and what that maximum might be. One of those ways is to draw the graph and read the coordinates of the highest or lowest point from it. Once we have the function we will use the TI83 to draw its graph and use the TRACE feature to help determine the coordinates of the lowest or highest point.
Example
The sum of the measures of the base and altitude of a triangle is 30. Find the measure of the base that will give a maximum area.
Solution
We could start by considering a particular value for the base. For example, if we let the base be 20, then the altitude is 10 (since the sum of the two is 30) and the area of the triangle is:
area = ½ x base x height = ½ (20)(10) = 100
We could do this for several other values. Record our results in a table and use regression on the TI83 to determine the function rule that relates the area to the length of the base.
Alternately, we can use the formula for the area of a triangle and substitute in an expression for the base and height based on the relation between them. That is the method shown in the interactive below.
We now have the function rule. In order to find if it has a maximum or minimum we will use the TI 83 to draw its graph. We will set the x values (representing the base) between 0 and 30, as this is what the problem suggests. We will set the minimum y value at 0 (area cannot be negative). The upper limit will be a guess, but considering the formula for the area of a triangle and the numbers involved it cannot exceed 450 (using max length for base and height ½ (30)(30)).
The graph of the function y = 15x - ½ x2 is shown below:
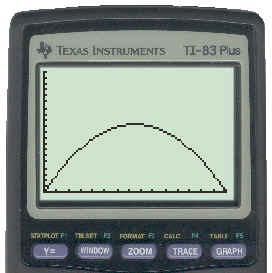
To see the key strokes necessary to get this graph click here.
The shape of the graph clearly indicates a maximum. We will now use the [TRACE] and scroll keys to move the cursor along the graph till it gets to the highest point (the maximum). This is shown below.
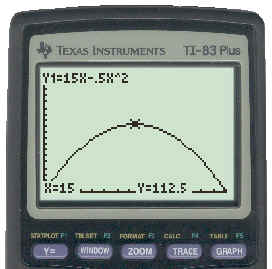
The maximum y value (area) is 112.5 and this occurs when x (the base of the triangle) is 15. Thus the base that gives the maximum area is 15.
You can also use the [CALC] and 4:maximum commands to get the same result. Starting with the graph above, the keystrokes necessary for doing this can be seen by clicking here.
You can also use the fMax and fMin commands under the [MATH] menu to give the maximum of a function in a specified domain. How to do that is left to you to discover if you wish.
Activity
- Complete Investigation 4 on page 20 of your text.
- Complete Investigation Questions 18 & 19 on page 20.
- Do the CYU Questions 20 - 22, 24 - 26 on pages 20 & 21
When you have completed these questions, ask your on-site teacher to get the solutions for you from the Teacher's Resource Binder and check them against your answers. After you do this, if there is something you had trouble with and still do not understand, contact your on-line teacher for help.
After you do the assigned activities, click on the Test Yourself button at the top of the page for a quick quiz on this lesson.
Test Yourself
- Find two numbers that differ by 20 and have a minimum product.