Learning Resources
Focus B: Comparing Linear and Non-linear RelationshipsTest yourselfAn automobile is tested for braking distances at various speeds with the following results:
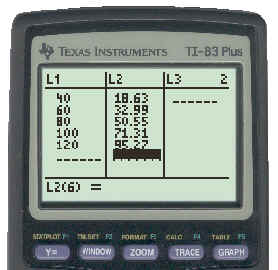
Using your TI83, enter the Speed data into L1 and the Distance data into L2 as shown below.
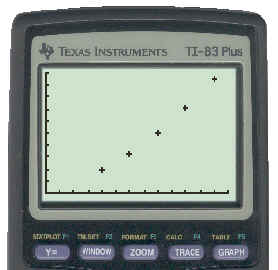
Next get a scatter plot of the data to see what its shape looks like. This is shown below.
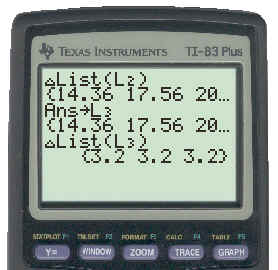
It is not obvious from the plot whether the data is linear or quadratic so we check the sequence of differences. This is shown below.
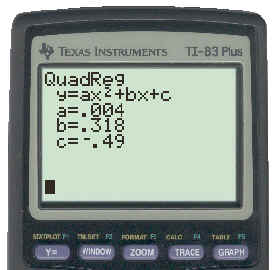
The second level differences are common so we perform a quadratic regression on the data. The results are shown below.
The equation of best fit is: y = 0.004x2 + 0.318x - 0.49 |