Learning Resources
Investigation 3: Analyzing Non-Linear DataTest yourself (Answers)Find the equation of the curve of best fit for the data in the table below:
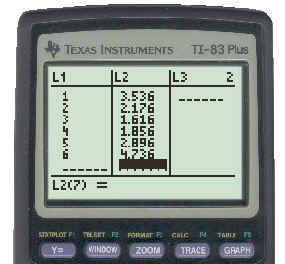
The first step is to enter the data into the TI83 in two lists as shown below.
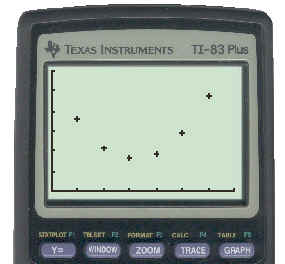
Then get a plot of the data to see the type of function that might fit it. This is shown below and the shape "looks" quadratic in nature.
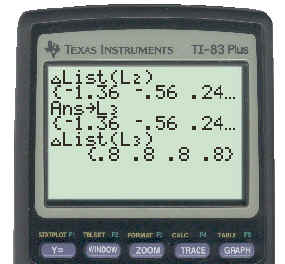
Check by looking at the second level differences as shown below. These are all the same, i.e. common. Therefore, since the second level differences are common, the data is quadratic.
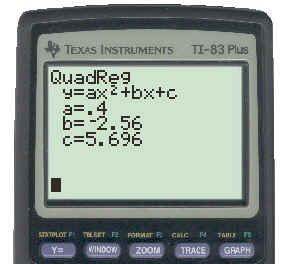
It is then a matter of doing a quadratic regression to get the equation of the curve of best fit. This is shown below.
The equation of the curve of best fit for the given data is: y = 0.4x2 -2.56x + 5.696 |