| Intermediate Technology Education | Energy and Power Technology | Pre-Design | Topic 3 | Optional Activity 2 |

Direct Current

Measuring Direct Current

You will do a simple activity that will result in a table which you will then use to produce a graph. You will need:

  • Multi-meter
  • 2 D cells
  • Battery box
  • Switch
  • Gear Motor
  • Stop watch or watch with a second hand

Prepare your digital multi-meter by making sure the probes are in the correct jacks for a voltage measurement. Using the selector knob, set the range to 20 volts DC.

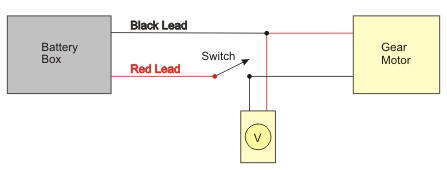
Next connect the components as shown in the block diagram below. Make sure the red battery box lead, the red motor lead and the red multi-meter probe are all connected together. Use alligator clips on the voltmeter probes if it helps.

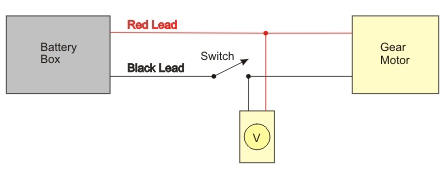
Figure. Block diagram for voltage measurement

Close the switch for a second to make sure the motor runs then open the switch.

Record the Measurement

Next you can print two sheets to record and present your information. Click each of the links below and print one copy for each of the students in your group. Note: You will need the adobe acrobat reader on your computer to do this:

Record the voltage supplied by the battery box every 5 seconds on the sheet with the two tables. Use the Trial 1 table.

When you have the sheets printed, one person can record, one can read the multi-meter, and if you have another in your group, one can read the stopwatch

Get ready, then...

  • Close the switch
  • Start your stopwatch and
  • Record the voltage at 5, 10, 15,....seconds up to 60 seconds.

Open the switch.

Reconfigure the Circuit

Reconfigure the circuit. Rearrange the components as shown in the diagram below. Simply switch the black and red battery box leads. Leave the motor leads and voltmeter probes connected as before.

Figure. Block diagram of voltage measurement with battery leads reversed

Test the circuit. The motor should turn in the opposite direction.

Record the Measurement

Repeat the measurements as in Step 2. This time the voltmeter should indicate a Negative sign on the reading. Record your reading in the Trial 2 table (the voltage readings should all be negative).

When you are finished open the switch.

Present the Measurement in Graphical Form

Using the Table 1 data, plot on the graph a point for 5 seconds and the voltage measured at 5 seconds. If the voltage is not a whole number estimate where the point should go and place a dot on the graph. Do the same for each of the other voltage-time pairs from Table 1.

On the same graph, plot the data from Table 2. Remember the voltages should be negative.

What Does the Graph Represent?

Direct Current electricity is usually defined as current flowing through a circuit in a constant direction. In this activity, you reversed the current direction in Trial 2. Look at the graph and answer the following questions:

  • How does the graph show that the current in the circuit has changed direction?
  • During the one minute the current was flowing, did the voltage change much?
  • What do you think the graph would look like if the switch was left on for several hours?