| Intermediate Technology Education | Energy and Power Technology | Pre-Design | Topic 3 | Optional Activity 3 |

Electrical Generation—AC

Generating Electricity

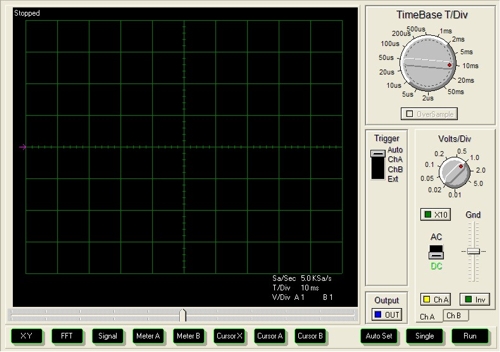
To help understand how electricity is generated you will do a simple activity using a different kind of voltmeter, a device called an oscilloscope.

Up until the widespread use of microcomputers, oscilloscopes were expensive devices usually found in science and engineering labs and on the technicians workbench. They used display screens related to traditional TV picture tubes to display the characteristics of electrical currents. Today we can use much cheaper oscilloscopes that plug into a computer's USB port and use the computer's monitor to display the information.

What you need:

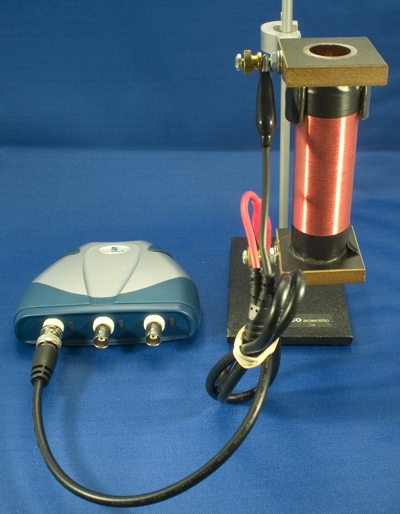
  • A USB Oscilloscope such as the DS1M12 Stingray
  • Oscilloscope software. USB-Instruments EASYSCOPE II
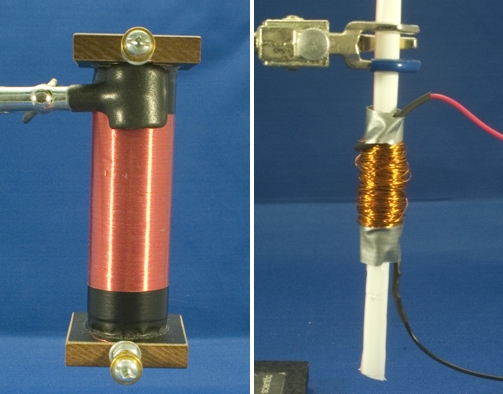
  • A good magnet. A rod shaped magnet would be best but a strong bar magnet will do.
  • A coil of fine copper wire. These coils can be found in a science lab but you can make one by winding lots of enameled "magnet" wire around a paper towel tube or a drink straw. 

Setting Up the Components

Here is the basic idea. You are going to drop your magnet through the coil of wire so you will need someone to hold the coil and someone to drop the magnet. If you have access to a lab stand and clamp you could mount the coil which would be more stable.

The ends of the coil of wire are connected to the two probes of the oscilloscope. If you made the coil using enameled magnet wire, use sandpaper or steel wool to clean about a centimeter of the wire's ends as the enamel is an insulator.

In the next image, the coil on the left is a standard lab coil. The one on the right is "home made" using a length of enameled copper wire and a drink straw.

Figure. Left image—Lab Coil. Right image—Copper wire wound on a drinking straw

The ends of the coil of wire are connected to the two probes of the oscilloscope. In the image below, the USB connection to the computer is not shown.

Fig. Copper wire coil connected to USB oscilloscope

The USB Oscilloscope

The oscilloscope display is really a windows application that is used to control and display a graph. The graph should be familiar, voltage on the y-axis and time on the x-axis. A typical oscilloscope display looks like this:

Figure. USB Oscilloscope Software Interface

Unlike the multi-meter, the oscilloscope has two controls. Like the multi-meter it has a voltage range selector, but it also has a time selector (called a timebase selector) because it can record time as well.

Make sure the oscilloscope is connected to your computer's USB port. Run the EASYSCOPE II software. You should see the same screen as illustrated above

Setting the Oscilloscope Controls

Channel: The 'scope has 2 inputs or channels. We will use channel A. Make sure it is selected by clicking the ChA Button and that your probes are connected to the channel A jack.

Voltage Range: Use your mouse to set the voltage selector to 0.2 volts (per division, that is each grid line on the y-axis represents 0.2 volts).

Leave any other controls set as shown below.

Time Base

Figure. Time Base Settings

Use the mouse to select 50ms (milliseconds) on the time base selector.

Trigger

Figure. Trigger Settings

The oscilloscope can be run continuously or in a trigger mode. In the trigger mode, the oscilloscope will not record or display any voltages until the voltage rises or falls by a particular amount. You can use trigger mode to capture the event of the voltage produced by the magnet falling through the coil of wire. Use the mouse to select the trigger for channel A. Leave the next switch on +ve and pull the slider control just above the middle position until the 'scope display reads 100 mV (millivolts) and the trigger arrow is halfway up the first grid block.


Figure. Left—Trigger Setting. Right—Trigger Display

Ready, Set, .....

If everything is ready, click the Single button on the lower row of oscilloscope. Note: if the oscilloscope triggers immediately it may be picking up electrical noise through the wire coil. In that case raise the trigger level slightly and try again.

Figure. Click the Single button

...Go

Mark one end of the magnet with a tiny strip of tape or with a marker. Now drop the magnet trough the coil. Make sure you don't hit the sides. If all is correct you should get a graph (sometimes called a trace) similar to the next illustration.

Figure. Voltage graph of magnet falling through a wire coil

Note: if you didn't get a trace similar to the one above and if it actually looks like the following, click the Single button (wait for the 'scope to reset) and drop the other end of the magnet through the coil.

Figure. Voltage graph of reversed magnet falling through a wire coil

Note: If the trace is upside down, click the Inverse button (Inv - see the first image in this step). You may have adjust the timebase, trigger level, and/or the volts/div to get a trace similar to the first illustration.

What does it Mean?

Once you have a good oscilloscope trace you can use it to explain what is happening as the magnet falls through the coil of wire. Consider the following diagram:

Figure. Trace of Magnet falling through a Coil

A trace of a single rise (or fall) in voltage is sometimes called a pulse. In this case we have 2 pulses, one positive and one negative. We can measure two other parameters from the trace.

  • Pulse width, also called the Time Period of the pulse can be measured on the x-axis (remember time is measured on the x-axis).
  • Pulse height, also called the Amplitude can be measured on the y-axis (remember the y-axis measures voltage).

Let's ask some questions and see if you can answer them based on your 'trace'.

  1. You should have a positive and a negative pulse. What does this mean in terms of the direction of the current in the wire coil (Hint: go back and look at the graphs from Activity 1)?
  2. As the magnet falls through the coil of wire it is obviously generating an electrical voltage. Look at the Time Periods (pulse width) for both pulses. Which pulse took longer to generate? Why?
  3. The Amplitude (pulse height) shows how much electrical voltage is generated. Which pulse had the higher voltage (it doesn't matter if it is positive or negative)? Why?
  4. Based on your answer in question 3, what effect does the speed of the magnet have on the voltage generated?
  5. There are generally 2 terms in use to describe the type of electricity, Direct Current (DC) and Alternating Current (AC). Which term could you apply to the electricity generated in this activity? Why?